Universal Discovery Interface (UDI)
Description
In this project, we propose to build the Universal Discovery Interface (UDI) for the Biomedical Data Fabric Toolbox. We define a discovery interface as a data-centric, visual user interface designed to support exploration and discovery in biomedical data resources such as data repositories, data warehouse, knowledgebases, data portals, and others. We propose a discovery interface that can be applied to essentially any biomedical data resource and therefore refer to it as a universal discovery interface. The Universal Discovery Interface will:
-
Provide an intuitive, exploratory approach for disease-agnostic discovery for a wide spectrum of biomedical data resources integrated into the Biomedical Data Fabric.
-
Broaden access to biomedical data resources to reach larger audiences of data consumers.
-
Increase effectiveness of exploratory interfaces for biomedical data resources.
-
Make design, implementation, and maintenance of biomedical data resources more efficient.
The Universal Discovery Interface (UDI) will be a set of frontend and backend software components and machine learning (ML) models that can be integrated with any biomedical data resource. Once integrated, the UDI will provide support for exploration and discovery within and across biomedical data resources through natural language driven generation of interactive visualizations and dashboards.
Gallery
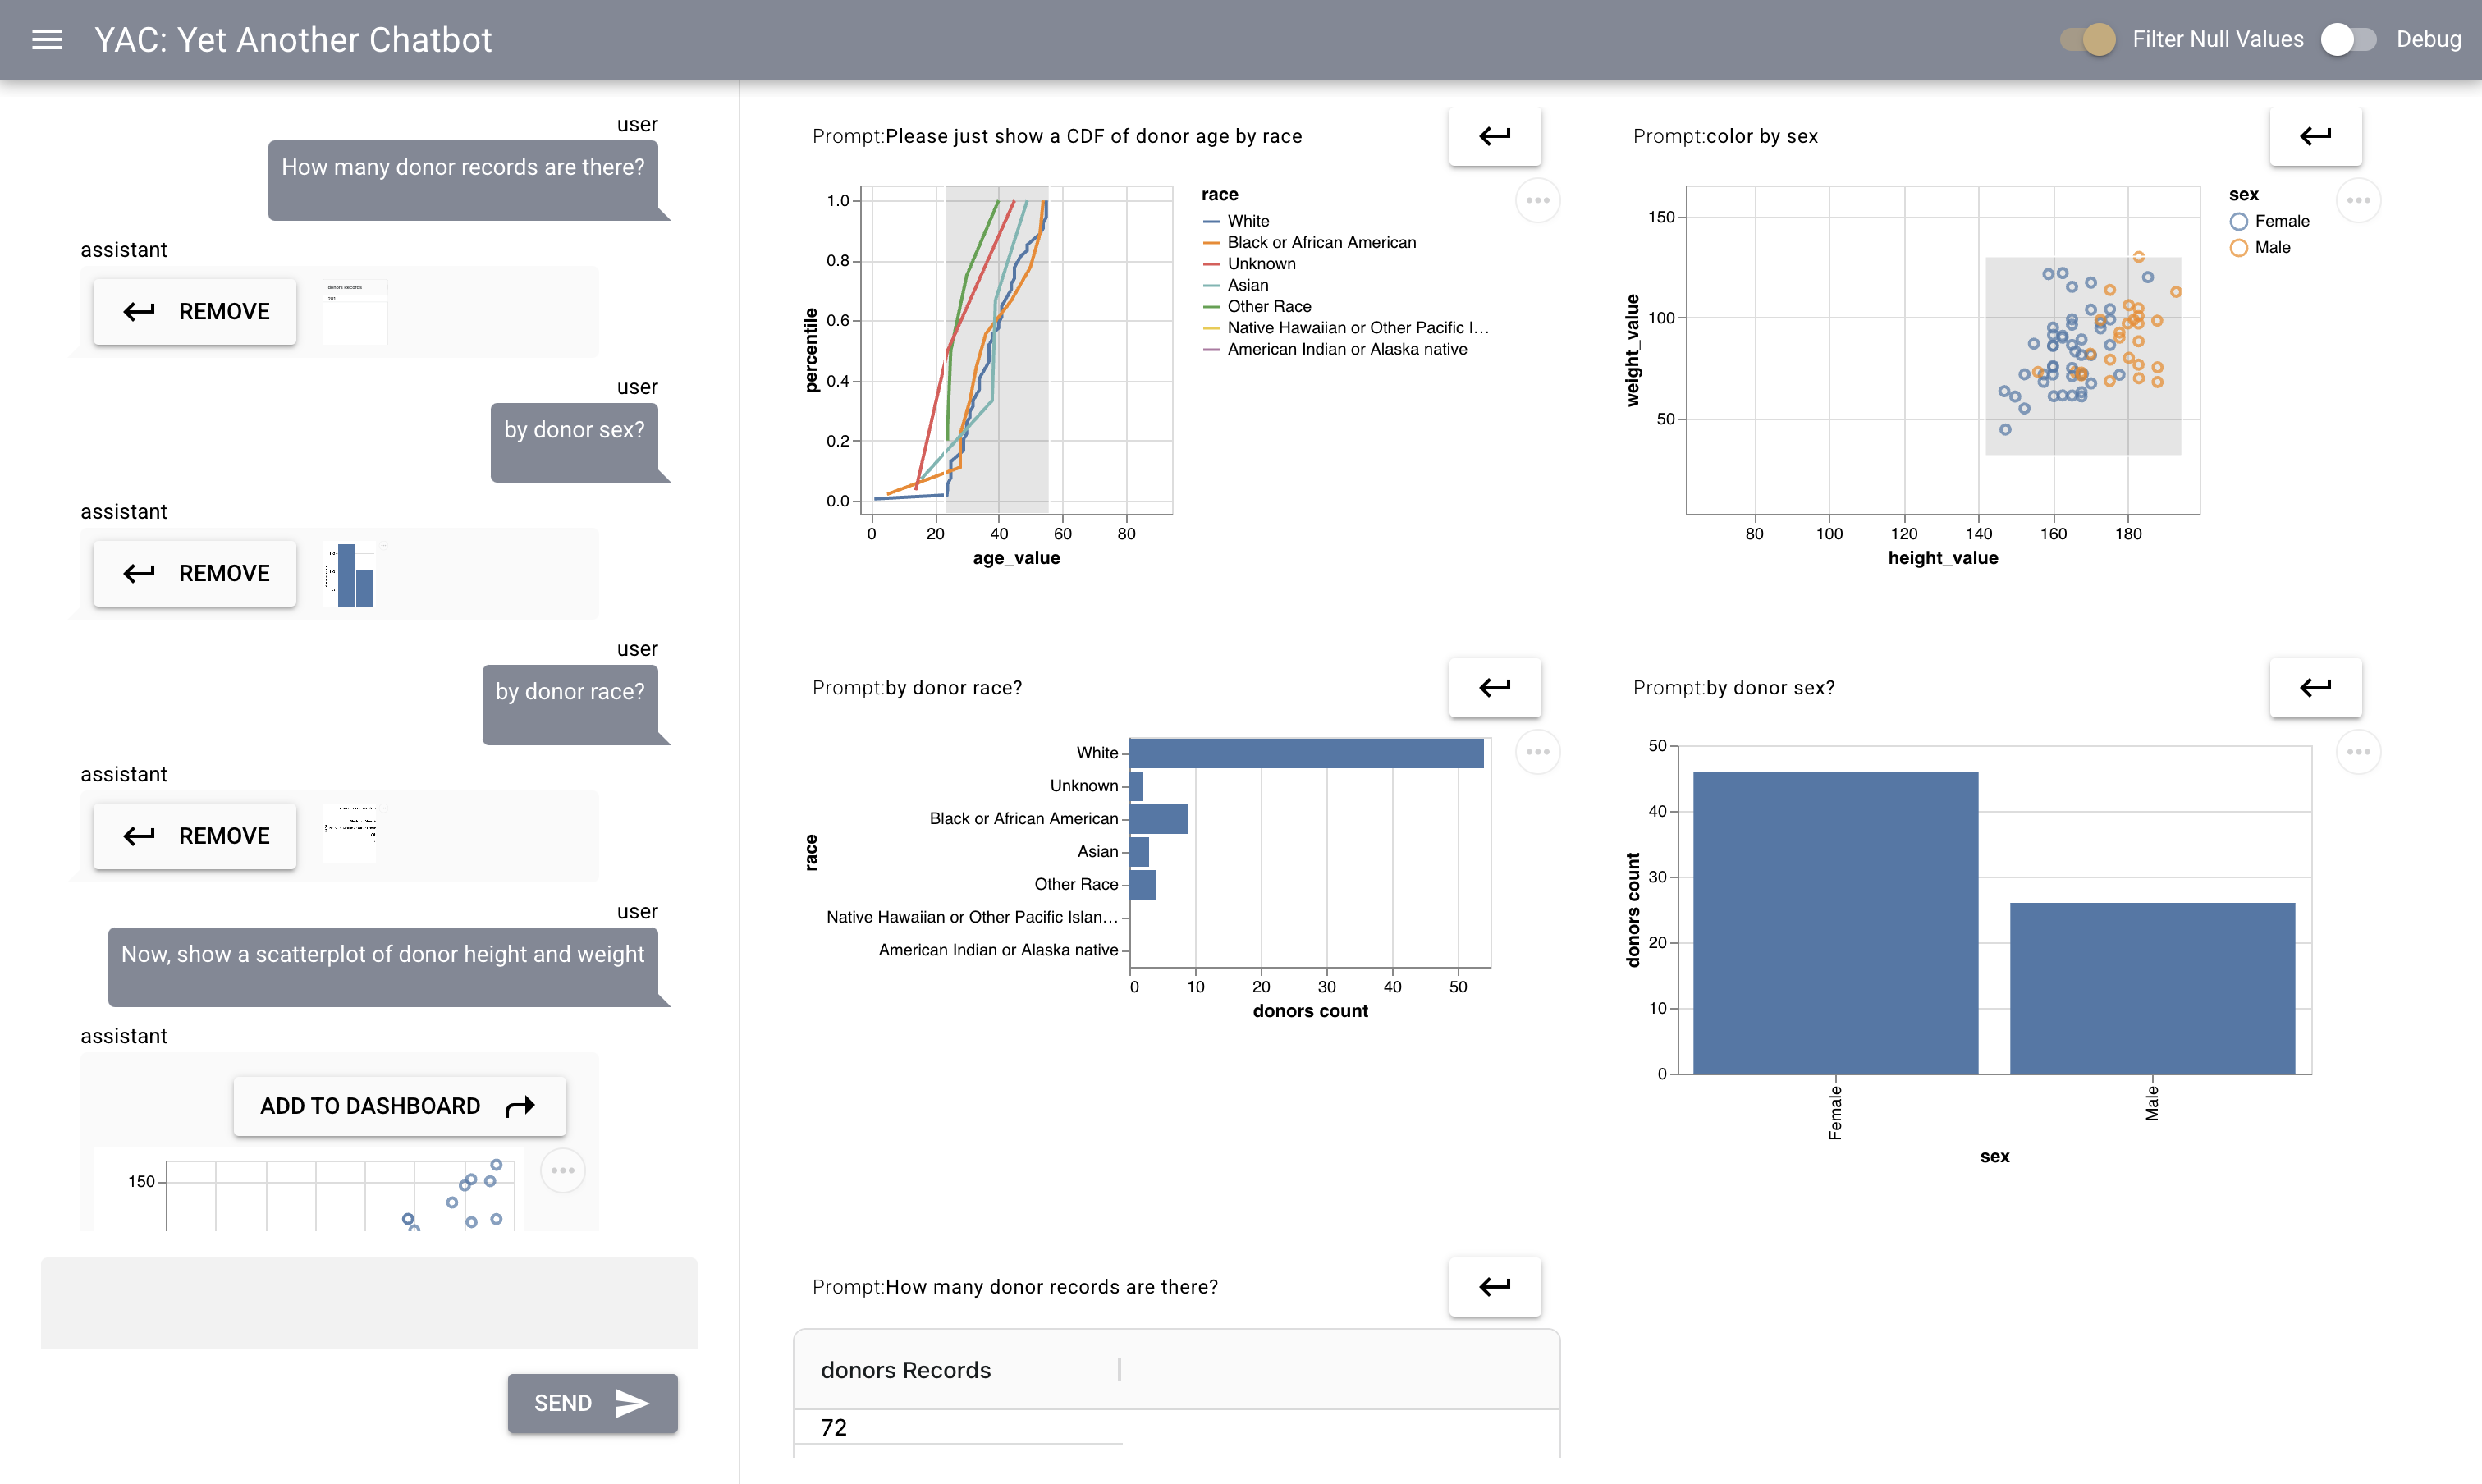 An image showing a chat conversation asking about the number of donor records on the left hand side and a collection of five charts on the right hand side. Clockwise from the upper left, the charts depict a CDF chart of donor age colored by race, a scatter plot of donor height vs weight colored by sex, a bar chart of donor sex, a table showing number of donor records and a bar chart of the donor count by race.
Publications
- DQVis Dataset: Natural Language to Biomedical Visualization
- YAC: Bridging Natural Language and Interactive Visual Exploration with Generative AI for Biomedical Data Discovery
- A Generative AI System for Biomedical Data Discovery with Grammar-Based Visualizations
Websites
-
Universal Discovery Interface Visualization Grammar
Details on the visualization grammar. -
OSF DQVis Dataset
Dataset of 1.08 million data-question-visualization triplets and 11.4 thousand two-step question samples. -
Universal Discovery Interface Toolkit
Viz toolkit npm package. -
Universal Discovery Interface Visualization Grammar Python Package
Python code for generating Universal Discovery Interface (UDI) specifications.
Software
GitHub
-
Universal Discovery Interface Visualization Grammar
The Universal Discovery Interface (UDI) Grammar repository includes TypeScript type definitions, a frontend visualization component for rendering UDI specifications, and a website with examples and a live editor. - Universal Discovery Interface Grammar Python
- DQVis Data Generation
- DQVis Data Review
Funding
- Accelerating Discovery with AI and Grammar-based Visual Exploration Interfaces for Biomedical Data Repositories (ARPA-H AY2AX000028)
Advanced Research Projects Agency - Health